Zabbix is a powerful open-source software designed for network and application monitoring. It is meticulously crafted to monitor and track the status of various network services, servers, and other network hardware and software components. Zabbix leverages real-time monitoring, data collection, graphs, and alerts to assist administrators in maintaining optimal system performance.
The Zabbix Agent is tailor-made to gather and transmit essential information regarding the health and performance of your nodes to the Zabbix server. This centralization of data enables efficient monitoring and global management of IT infrastructures. What’s more, the installation and configuration of the Zabbix Agent can be effortlessly carried out, often with just a few clicks, thanks to its user-friendly interface.
Understanding Zabbix: A Powerful Monitoring Solution
Monitoring and maintaining the health and performance of your network and applications are critical tasks for any IT administrator. Zabbix, as an open-source solution, offers a robust set of tools to streamline this process and ensure your systems run seamlessly.
The Core Features of Zabbix
1. Real-Time Monitoring: Zabbix provides real-time insights into the state of your network and applications. It constantly checks the availability and performance of your infrastructure components, helping you detect issues promptly.
2. Data Collection: The software collects and stores data from various sources, allowing you to analyze historical trends and make informed decisions about your IT environment.
3. Data Visualization: Zabbix’s graphical capabilities enable you to create detailed graphs and charts, making it easier to identify performance patterns and anomalies.
4. Alerting System: Zabbix’s alerting system notifies administrators when predefined thresholds are breached, ensuring prompt action can be taken to resolve issues.
Simplified Agent Installation and Configuration
One of the key strengths of Zabbix is its ease of use. Installing and configuring the Zabbix Agent is a straightforward process, typically accomplished with just a few clicks through its intuitive user interface.
Steps to One-Click Zabbix Installation at Hidora 🙂
1. Download and install the Agent:
1. Visit the Hidora Marketplace to install the Zabbix server. The market place is located at the top left of the dashboard.
2. Search for ‘Zabbix’ In the marketplace search bar.
3. Select ‘Zabbix Server’ and follow the installation process, accepting the necessary prompts. All you need to do is enter the name of the environment and the region where you want to host it.
4. Wait a few minutes for the installation to complete.It will display a pop-up window with the server access link and the user and password.
2. Configuration
- After installation, access the Zabbix server by going to the provided link.
- The default login credentials are ‘Admin’ (with a capital “A”) and ‘Zabbix’.

3. Start the Agent:
- Install the Zabbix agent on all the nodes you wish to monitor by copying the private IP address of the Zabbix server, as demonstrated in the video.
- The Zabbix agent is in the form of an Add-On, you can find it by clicking on this icon:
- When the agent is ready, this message will appears:
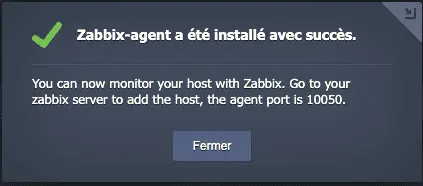
- Add a Host. Follow the steps to add a host in the Zabbix server dashboard.
Once the ‘ZBX’ status turns green, communication is established and metrics are available:
Your node is now ready to transmit data to the Zabbix server, and you can commence monitoring its health and performance.
Zabbix’s agent-based approach simplifies the process of gathering critical data about your IT infrastructure, making it an invaluable tool for administrators looking to maintain a robust and reliable network and application ecosystem.
In conclusion, Zabbix’s open-source nature, combined with its powerful monitoring capabilities and user-friendly agent installation and configuration, positions it as a top choice for IT professionals seeking an effective solution for network and application monitoring. Whether you’re managing a small network or a large-scale enterprise environment, Zabbix can help you maintain optimal system performance and ensure the smooth operation of your IT infrastructure.
