
Le monitoring de la santé du réseau et des applications est crucial pour les administrateurs IT. Zabbix, un outil open source puissant, simplifie ce processus pour maintenir des performances système optimales. Dans ce guide, nous explorons ce que Zabbix propose, comment le configurer sur Hidora, et pourquoi il mérite une place dans votre boîte à outils de monitoring.

Qu'est-ce que Zabbix ?
Zabbix est un logiciel open source conçu pour le monitoring de réseaux et d'applications. Il est construit pour surveiller et suivre l'état de divers services réseau, serveurs et autres composants matériels et logiciels. Zabbix s'appuie sur le monitoring en temps réel, la collecte de données, les graphiques et les alertes pour aider les administrateurs à maintenir des performances système optimales.
L'agent Zabbix collecte et transmet les informations essentielles sur la santé et les performances de vos noeuds au serveur Zabbix. Cette centralisation des données permet un monitoring efficace et une gestion globale des infrastructures IT. L'installation et la configuration de l'agent Zabbix peuvent être réalisées en quelques clics, grâce à son interface intuitive.
Les fonctionnalités principales de Zabbix
Monitoring en temps réel
Zabbix fournit des informations en temps réel sur l'état de votre réseau et de vos applications. Il vérifie en permanence la disponibilité et les performances de vos composants d'infrastructure, vous aidant à détecter les problèmes rapidement. Qu'il s'agisse d'un serveur dont l'espace disque diminue, d'une interface réseau qui perd des paquets ou d'une application qui répond lentement, Zabbix le détecte au moment où cela se produit.
Collecte et stockage de données
Le logiciel collecte et stocke des données provenant de sources variées, vous permettant d'analyser les tendances historiques et de prendre des décisions éclairées sur votre environnement IT. Ces données historiques sont précieuses pour la planification de capacité, l'optimisation des performances et l'identification de patterns récurrents qui pourraient indiquer des problèmes sous-jacents.
Visualisation des données
Les capacités graphiques de Zabbix vous permettent de créer des graphiques et des diagrammes détaillés, facilitant l'identification des patterns de performance et des anomalies. Les tableaux de bord peuvent être personnalisés pour afficher exactement les métriques qui comptent pour votre équipe, de l'utilisation CPU du serveur aux temps de réponse applicatifs.
Système d'alertes
Le système d'alertes de Zabbix notifie les administrateurs lorsque des seuils prédéfinis sont dépassés, garantissant une action rapide pour résoudre les problèmes. Les alertes peuvent être envoyées via plusieurs canaux : email, Slack, SMS et webhooks personnalisés. Votre équipe est ainsi toujours informée, quel que soit son canal de communication préféré.
Installation de Zabbix sur Hidora, étape par étape
La mise en place de Zabbix sur Hidora est simple. Voici comment démarrer.
Étape 1 : Installer le serveur Zabbix
- Rendez-vous sur le Marketplace Hidora, situé en haut à gauche du tableau de bord.
- Recherchez "Zabbix" dans la barre de recherche du marketplace.
- Sélectionnez "Zabbix Server" et suivez le processus d'installation en acceptant les invites nécessaires. Il vous suffit d'entrer le nom de l'environnement et la région où vous souhaitez l'héberger.
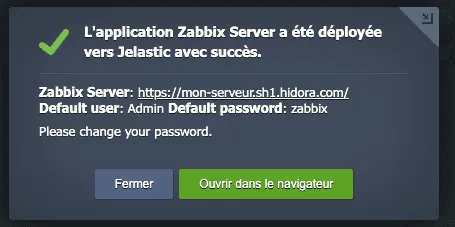
- Patientez quelques minutes le temps que l'installation se termine. Une fenêtre pop-up affichera le lien d'accès au serveur ainsi que le nom d'utilisateur et le mot de passe.
Étape 2 : Configurer le serveur
Après l'installation, accédez au serveur Zabbix via le lien fourni. Les identifiants par défaut sont "Admin" (avec un A majuscule) et "zabbix". Nous recommandons fortement de changer le mot de passe par défaut immédiatement après votre première connexion.
Prenez quelques minutes pour explorer l'interface. Le tableau de bord principal vous donne une vue d'ensemble de vos hôtes surveillés, des problèmes récents et de l'état du système. Naviguez vers Configuration > Hôtes pour voir la liste des noeuds surveillés, qui sera vide tant que vous n'aurez pas installé d'agents.
Étape 3 : Installer et démarrer l'agent
Installez l'agent Zabbix sur tous les noeuds que vous souhaitez surveiller. Vous aurez besoin de l'adresse IP privée du serveur Zabbix pour cette étape.
L'agent Zabbix est disponible en tant qu'Add-On sur la plateforme Hidora. Une fois installé, un message de confirmation indique que l'agent est prêt. Suivez ensuite ces étapes pour ajouter un hôte dans le tableau de bord du serveur Zabbix :
- Allez dans Configuration > Hôtes > Créer un hôte
- Entrez le nom de l'hôte et l'adresse IP du noeud
- Assignez un groupe d'hôtes (par exemple, Serveurs Linux, Serveurs d'applications)
- Liez les modèles appropriés pour le type de monitoring dont vous avez besoin

Une fois que l'indicateur de statut "ZBX" passe au vert, la communication est établie et les métriques circulent. Votre noeud transmet désormais ses données au serveur Zabbix.
Configuration avancée : aller plus loin avec Zabbix
Une fois l'installation de base fonctionnelle, Zabbix offre des capacités avancées qui permettent de passer d'un monitoring réactif à un monitoring véritablement proactif.
Discovery automatique des hôtes
Plutôt que d'ajouter chaque noeud manuellement, configurez la découverte automatique. Zabbix scanne votre réseau et ajoute automatiquement les hôtes qui répondent à vos critères. C'est particulièrement utile dans les environnements dynamiques où les instances sont créées et supprimées fréquemment, par exemple sur une infrastructure Hidora avec auto-scaling.
Naviguez vers Configuration > Discovery et créez une règle de découverte en spécifiant la plage d'adresses IP de votre réseau interne. Zabbix détectera les agents installés et appliquera automatiquement les modèles de monitoring appropriés.
Monitoring des certificats SSL
Pour les entreprises qui gèrent plusieurs domaines ou applications web, Zabbix peut surveiller l'expiration de vos certificats SSL/TLS. C'est une vérification souvent oubliée qui peut provoquer des interruptions de service embarrassantes. Configurez un item de type "Web scenario" qui vérifie régulièrement la date d'expiration et vous alerte 30 jours avant l'échéance.
Surveillance des logs applicatifs
Au-delà des métriques système, Zabbix peut analyser vos fichiers de logs en temps réel. Configurez des items de type "log" pour surveiller les fichiers critiques de vos applications. Par exemple, surveillez les logs Apache ou Nginx pour détecter un taux d'erreurs 5xx anormal, ou les logs de votre base de données pour identifier les requêtes lentes qui dépassent un seuil défini.
Stratégies d'alerting efficaces
Un bon monitoring sans un bon alerting n'a que peu de valeur. Voici comment structurer vos alertes pour maximiser leur utilité sans provoquer de fatigue d'alerte chez vos équipes.
Catégoriser la sévérité
Définissez clairement trois niveaux de sévérité et les actions associées :
- Critique : intervention immédiate requise (service down, espace disque > 95%, certificat expiré). Notification par SMS et appel téléphonique automatique.
- Avertissement : investigation nécessaire dans les 4 heures (CPU > 85% depuis 15 minutes, espace disque > 80%, latence réseau dégradée). Notification par email et Slack.
- Information : à traiter lors de la prochaine revue (mises à jour disponibles, seuils approchés, tendances anormales). Notification par email uniquement, regroupée en digest quotidien.
Éviter la fatigue d'alerte
Le piège le plus courant est de générer trop d'alertes. Quand une équipe reçoit 50 notifications par jour, elle finit par toutes les ignorer, y compris les critiques. Commencez avec un nombre restreint d'alertes (10-15 règles maximum) et ajoutez-en progressivement. Utilisez les fonctions de suppression de Zabbix pour éviter les alertes en cascade : si un switch réseau tombe, vous ne voulez pas recevoir une alerte pour chaque serveur qui devient inaccessible derrière ce switch.
Intégration avec les outils de communication
Zabbix s'intègre nativement avec les principaux outils de communication d'entreprise. Configurez les webhooks pour envoyer les alertes directement dans vos canaux Slack ou Microsoft Teams. Pour les équipes qui utilisent PagerDuty ou Opsgenie pour la gestion des astreintes, Zabbix supporte ces intégrations via des media types personnalisés. L'objectif est que l'alerte arrive là où se trouve l'équipe, pas dans une boîte email que personne ne consulte à 3h du matin.
Mettre en place un monitoring efficace
Une fois Zabbix opérationnel, plusieurs bonnes pratiques permettent d'optimiser votre monitoring.
Définir des seuils pertinents
Ne vous fiez pas uniquement aux seuils par défaut. Analysez vos patterns de fonctionnement normaux et définissez des seuils qui reflètent votre environnement réel. Un serveur qui tourne habituellement à 70% de CPU nécessite des seuils d'alerte différents d'un serveur qui se situe normalement à 20%.
Créer des tableaux de bord personnalisés
Construisez des tableaux de bord qui donnent à votre équipe une visibilité instantanée sur ce qui compte le plus. Regroupez les métriques liées entre elles. Par exemple, créez un tableau de bord pour votre cluster de bases de données qui affiche les performances des requêtes, les I/O disque, le lag de réplication et le nombre de connexions dans une seule vue.
Configurer des politiques d'escalade
Mettez en place des politiques d'escalade pour que si un problème n'est pas acquitté dans un certain délai, il soit remonté aux membres seniors de l'équipe. Cela garantit que les problèmes critiques ne passent jamais inapercus, même en dehors des heures de bureau.
Utiliser les modèles intelligemment
Zabbix est livré avec une riche bibliothèque de modèles de monitoring pour les applications et services courants. Utilisez-les comme points de départ, puis personnalisez-les pour correspondre à vos besoins spécifiques. Des modèles pour Apache, Nginx, MySQL, PostgreSQL, Docker et Kubernetes sont disponibles nativement.
Pourquoi Zabbix pour votre infrastructure ?
La nature open source de Zabbix, combinée à ses capacités de monitoring puissantes et à son installation conviviale, en fait un choix de premier plan pour les professionnels IT. Que vous gériez un petit réseau ou un environnement d'entreprise à grande échelle, Zabbix s'adapte à vos besoins.
Chez Hidora, Zabbix s'intègre parfaitement à notre plateforme. L'installation en un clic depuis le marketplace, combinée au monitoring par agent, signifie que vous pouvez avoir une visibilité complète sur votre infrastructure en quelques minutes.
Pour les organisations qui souhaitent aller plus loin dans leur stratégie d'observabilité, notre équipe de consulting peut vous aider à concevoir une architecture de monitoring complète combinant Zabbix avec d'autres outils comme OpenSearch, Grafana et Prometheus. Notre équipe de services managés peut également prendre en charge la maintenance et l'optimisation continues de votre stack de monitoring.
Ressources complémentaires
Le monitoring n'est pas une activité que l'on configure et que l'on oublie. Il nécessite une attention continue, des ajustements et une adaptation à mesure que votre infrastructure évolue. Avec Zabbix et Hidora, vous disposez des outils et du support pour maintenir vos systèmes en bonne santé et au meilleur de leurs performances.

Responsable Produit Cloud
Responsable Produit Cloud chez Hidora. Spécialiste Kubernetes, IaC et observabilité.


