
Monitoring network and application health is crucial for IT administrators. Zabbix, a powerful open-source tool, streamlines this process to help maintain seamless system performance. In this guide, we walk through what Zabbix offers, how to set it up on Hidora, and why it belongs in your monitoring toolkit.
What is Zabbix?
Zabbix is an open-source software designed for network and application monitoring. It is built to monitor and track the status of various network services, servers, and other network hardware and software components. Zabbix leverages real-time monitoring, data collection, graphs and alerts to assist administrators in maintaining optimal system performance.
The Zabbix Agent gathers and transmits essential information about the health and performance of your nodes to the Zabbix server. This centralization of data enables efficient monitoring and global management of IT infrastructures. The installation and configuration of the Zabbix Agent can be carried out with just a few clicks, thanks to its user-friendly interface.
Zabbix supports multiple data collection methods beyond its native agent. SNMP polling and trapping allow you to monitor network devices such as switches, routers and firewalls without installing any software on them. IPMI monitoring covers hardware-level metrics like temperature, fan speed and power supply status on physical servers. JMX monitoring integrates with Java applications to track JVM heap usage, thread counts and garbage collection metrics. For web applications, Zabbix can execute synthetic HTTP checks that simulate user journeys and measure response times at each step.
Core features of Zabbix
Real-time monitoring
Zabbix provides real-time insights into the state of your network and applications. It constantly checks the availability and performance of your infrastructure components, helping you detect issues promptly. Whether it's a server running low on disk space, a network interface experiencing packet loss, or an application responding slowly, Zabbix catches it as it happens.
Data collection and storage
The software collects and stores data from various sources, allowing you to analyze historical trends and make informed decisions about your IT environment. This historical data is invaluable for capacity planning, performance optimization and identifying recurring patterns that might indicate underlying issues.
Zabbix uses a relational database backend (PostgreSQL or MySQL) to store collected metrics. For high-volume environments collecting millions of data points per day, the housekeeper process manages data retention automatically. You can configure different retention periods for different data types: keep raw data for 7 days, hourly trends for 90 days, and daily trends for a full year. This tiered approach keeps your database manageable while preserving long-term visibility into infrastructure behavior.
Data visualization
Zabbix's graphical capabilities enable you to create detailed graphs and charts, making it easier to identify performance patterns and anomalies. Dashboards can be customized to show exactly the metrics that matter to your team, from server CPU usage to application response times.
Alerting system
Zabbix's alerting system notifies administrators when predefined thresholds are breached, ensuring prompt action can be taken to resolve issues. Alerts can be sent through multiple channels, including email, Slack, SMS and custom webhooks, so your team is always informed regardless of their preferred communication method.
Zabbix in a Kubernetes environment
For organizations running containerized workloads, Zabbix adapts well to Kubernetes monitoring. The Zabbix Kubernetes operator allows you to deploy the agent as a DaemonSet, ensuring every node in your cluster is covered. Zabbix can monitor pod health, container resource consumption, node conditions and cluster-level events.
When combined with Prometheus exporters, Zabbix can ingest application-specific metrics exposed by your services. This gives you a single pane of glass that covers both traditional infrastructure (VMs, bare-metal servers, network devices) and modern containerized workloads. For Swiss companies running hybrid environments (some legacy applications on VMs alongside newer microservices on Kubernetes), this unified view eliminates the need for separate monitoring tools.
Zabbix also supports service-level monitoring through its built-in SLA reporting. You can define service trees that map business services to their underlying infrastructure components. If a database node degrades, Zabbix calculates the impact on the parent business service and alerts accordingly. This is particularly valuable for organizations bound by SLA commitments, as it provides auditable uptime reports with minimal configuration.
Step-by-step Zabbix installation on Hidora
Setting up Zabbix on Hidora is straightforward. Here's how to get started.
Step 1: Install the Zabbix server
- Visit the Hidora Marketplace, located at the top left of the dashboard.
- Search for "Zabbix" in the marketplace search bar.
- Select "Zabbix Server" and follow the installation process, accepting the necessary prompts. You only need to enter the environment name and the region where you want to host it.
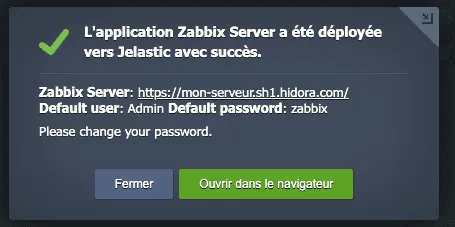
- Wait a few minutes for the installation to complete. A pop-up window will display the server access link along with the username and password.
Step 2: Configure the server
After installation, access the Zabbix server through the provided link. The default login credentials are "Admin" (with a capital A) and "zabbix". We strongly recommend changing the default password immediately after your first login.
Take a few minutes to explore the interface. The main dashboard gives you an overview of your monitored hosts, recent problems and system status. Navigate to Configuration > Hosts to see the list of monitored nodes, which will be empty until you install agents.
Step 3: Install and start the agent
Install the Zabbix agent on all the nodes you wish to monitor. You'll need the private IP address of the Zabbix server for this step.
The Zabbix agent is available as an Add-On in the Hidora platform. Once installed, you'll see a confirmation message indicating the agent is ready. Then follow these steps to add a host in the Zabbix server dashboard:
- Go to Configuration > Hosts > Create host
- Enter the host name and the IP address of the node
- Assign a host group (e.g., Linux servers, Application servers)
- Link appropriate templates for the type of monitoring you need

Once the "ZBX" status indicator turns green, communication is established and metrics are flowing. Your node is now transmitting data to the Zabbix server.
Setting up effective monitoring
Once Zabbix is running, there are several best practices to follow for effective monitoring.
Define meaningful thresholds
Don't rely solely on default thresholds. Analyze your normal operating patterns and set thresholds that reflect your actual environment. A server that typically runs at 70% CPU usage needs different alert thresholds than one that normally sits at 20%.
Create custom dashboards
Build dashboards that give your team instant visibility into what matters most. Group related metrics together. For example, create a dashboard for your database cluster that shows query performance, disk I/O, replication lag and connection counts in a single view.
Configure escalation policies
Set up escalation policies so that if a problem isn't acknowledged within a certain timeframe, it gets escalated to senior team members. This ensures that critical issues never go unnoticed, even during off-hours.
Use templates wisely
Zabbix comes with a rich library of monitoring templates for common applications and services. Use them as starting points, then customize them to match your specific requirements. Templates for Apache, Nginx, MySQL, PostgreSQL, Docker and Kubernetes are all available out of the box.
Implement auto-discovery
For growing infrastructures, manually registering every host becomes impractical. Zabbix's network discovery and auto-registration features scan your network for new devices and automatically add them to monitoring with the appropriate templates. Define discovery rules by IP range or DNS pattern, and Zabbix handles the rest. When a new application server joins your cluster, it appears in your dashboard within minutes without any manual intervention. This is especially useful in cloud environments where instances are created and destroyed frequently.
Zabbix vs. other monitoring tools
Administrators often ask how Zabbix compares to alternatives like Prometheus, Nagios or Datadog. The answer depends on your context.
Prometheus excels at metrics collection in cloud-native environments and pairs naturally with Grafana for visualization, but it lacks built-in alerting escalation and long-term storage without additional components like Thanos or Cortex. Nagios is a mature choice for traditional infrastructure but its configuration is cumbersome and its interface dated. Datadog provides a polished SaaS experience but sends your monitoring data to external servers, which raises sovereignty concerns for Swiss regulated industries, and costs scale quickly as your host count grows.
Zabbix occupies a unique position: it combines agent-based depth with a self-hosted model that keeps all data within your own infrastructure. For organizations operating under Swiss data protection law or industry-specific regulations, this self-hosted approach means monitoring data never leaves your perimeter. The trade-off is that Zabbix requires more initial configuration than a SaaS tool, but the long-term flexibility and data control justify the investment.
Why Zabbix for your infrastructure?
Zabbix's open-source nature, combined with its powerful monitoring capabilities and user-friendly installation, makes it a top choice for IT professionals. Whether you're managing a small network or a large-scale enterprise environment, Zabbix scales with your needs.
At Hidora, Zabbix integrates seamlessly with our platform. The one-click installation from the marketplace, combined with agent-based monitoring, means you can have comprehensive visibility into your infrastructure within minutes, not hours.
For organizations looking to go further with their observability strategy, our consulting team can help you design a complete monitoring architecture that combines Zabbix with other tools like OpenSearch, Grafana and Prometheus. And our managed services team can handle the ongoing maintenance and optimization of your monitoring stack, so you can focus on what matters most: building great products.
Further resources
Monitoring is not a set-and-forget activity. It requires ongoing attention, tuning and adaptation as your infrastructure evolves. With Zabbix and Hidora, you have the tools and support to keep your systems healthy and performing at their best.

Cloud Product Manager
Cloud Product Manager at Hidora. Specialist in Kubernetes, IaC and observability.

